
Across the UK, occupancy rates in 30,000+ sq. ft. spaces hit 89%, signaling potential shortfall in larger supply.
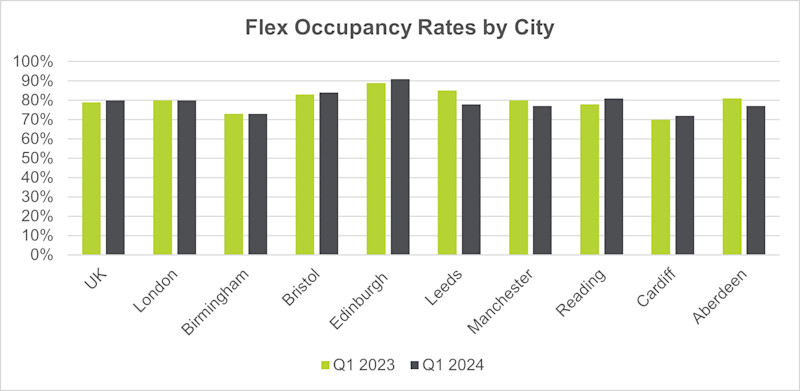
Occupancy rates in flexible workspaces across the UK are continuing to trend upwards despite subdued demand throughout 2023. Current occupancy rates throughout the UK in Q1 2024 stand at 80% according to The Instant Group’s data, up slightly from 79% compared to the same period in 2023.
Positively, 39% of flexible workspaces are over 90% occupied, which indicates that flexibility and diverse workspace environments are key strategic drivers for businesses in 2024. Companies already using flex are clearly staying put, while others are exploring hybrid solutions to offer more workplace choice to their workers.
As business strategies and worker preferences evolve, occupancy rates continue to vary by city, size of space, and quality of product.
Key insights:
- Stable occupancy rate of 80% across the UK is a strong indicator that flex is the solution for hybrid teams.
- Within London, areas such as Westminster, Southwark, and the City of London boast occupancy rates higher than the market average of 80%.
- The impact of hybrid working is causing fluctuations in both suburban and city center locations as new working patterns continue to evolve, with Bristol city center boasting 86% occupancy.
- Occupancy rates within quality, amenity-driven, and service-led spaces are the highest in the market – 82% across the UK and 84% in London.
- The growing use of flex by larger companies is resulting in the highest occupancy rates within spaces over 30,000 sq. ft., currently averaging 89%.
City Dynamics: Occupancy Variations and Resilience
Variation in occupancy across UK cities underscores the diverse regional dynamics at play, with certain areas maintaining a stronghold despite fluctuations.
Despite impressive 3% supply growth over the past year, the highest growth of any city, occupancy within London has remained at 80%, which is a positive sign for the capital. There are variations across the city, with Westminster (86%), Southwark (85%), the City of London (84%), and Soho (82%) all outpacing the city average.
Urban vs Suburban
Rising occupancy rates has become a unified trend across both city centers and suburban areas. In Manchester and Leeds, the city center is faring better than the outskirts, a trend that has been evident since early 2023. Manchester's city center boasts a 78% occupancy rate, outpacing the outskirts at 75%, while in Leeds, the city center slightly edges out the outskirts with a 79% occupancy compared to 78%. However, the gap is closing, with Leeds city center occupancy reaching 88% in Q1 2023 versus 78% in the outskirts.
In Birmingham the gap is widening, with the city center currently at 67% occupancy against 79% in the outskirts. Meanwhile, in Bristol the tides have turned, with the city center increasing from 81% in Q1 2023 to 86% in Q1 2024, while occupancy in the suburbs has declined from 87% to 82% during the same period.
As new ways of working continue to evolve and hybrid patterns are yet to remain static, we are still seeing fluctuations in both urban and suburban locations. This is evidence of companies re-aligning their workspace strategies and people still trying to find their new working rhythm.
Flight to Quality Driving High Occupancy Rates
Despite fluctuating occupancy rates across cities, one uniting trend is a preference for quality. Premium spaces, which we define as low-density, serviced-focused workspace, are seeing the highest occupancy rates in the UK. Occupancy rates at the premium end of the market are currently averaging 82% across the UK, compared to 80% for the rest of the market.
This trend is even more pronounced in London, where high-end spaces have reached 84% occupancy, while the rest of the market averages 77%. Businesses are competing for the right space in the right location, which is having a knock-on effect on pricing.
Increasing demand for quality spaces coupled with high occupancy rates has resulted in rates for premium products increasing 12% across the UK in Q1 2024 over the same period in 2023. For now, at least, people are willing to pay a premium for great space.
Occupiers’ Shifting Demands Driving Landlord Decision-Making
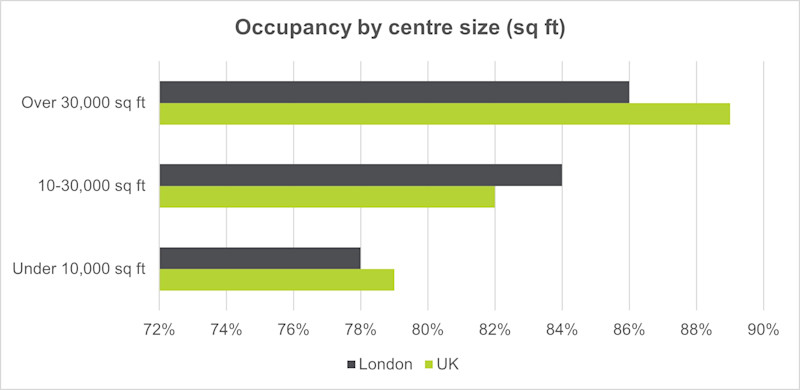
Occupancy rates within flexible workspaces over 30,000 sq. ft. are significantly higher than those in spaces under 10,000 sq. ft. Across the UK, larger spaces currently boast occupancy rates averaging 89%, a whole 10 percentage points higher than that for spaces under 10,000 sq. ft.
This is also the case within London, where spaces over 30,000 sq. ft. average 86% occupancy, compared to 78% in those under 10,000 sq. ft.
One driver for this is the preference for larger requirements. Businesses are seeking a combination of private and open-access spaces to accommodate fluctuating demands and company growth. In 2023, over 60% of desk placements in London stemmed from requirements for over 26 people, underlining the evolving needs of larger corporate clients.
We expect this trend of larger flex requirements to accelerate interest among landlords to deliver a more diverse offering of flexible space solutions. In fact, across the UK, 58% of landlords expect at least 26% of their portfolio to be flex by 2030¹. This is likely to rise as larger companies continue to move from traditional leases to more flexible workspace and managed office solutions.
Resilience Amidst an Evolving Landscape
Fluctuating occupancy rates across the UK landscape reflect a dynamic environment shaped by evolving real estate strategies and shifting work preferences. Within a tough real estate market, occupancy rates within flexible workspaces have remained robust, suggesting that other forms of flexible space, such as flexible leases, managed options, and turnkey workspaces, will increasingly appeal to occupiers and underpin the future of the flex sector, particularly the growth and diversification of flexible space products.
Methodology
Data within the report is compiled via The Instant Group’s leading flexible workspace data platform Instant Insights.
Sources:
1. The Instant Group, Future of Flex Survey 2023


Our experts can deliver insights or a flexible workspace report tailored to your specifications.