
As overall occupancy rates drop by 9% in the UK between April and November 2020, we look at the real impact of Covid-19 on workspace de-densification and location choice.
KEY FINDINGS
- Overall occupancy rates have dropped by 9% in the UK between April and November 2020
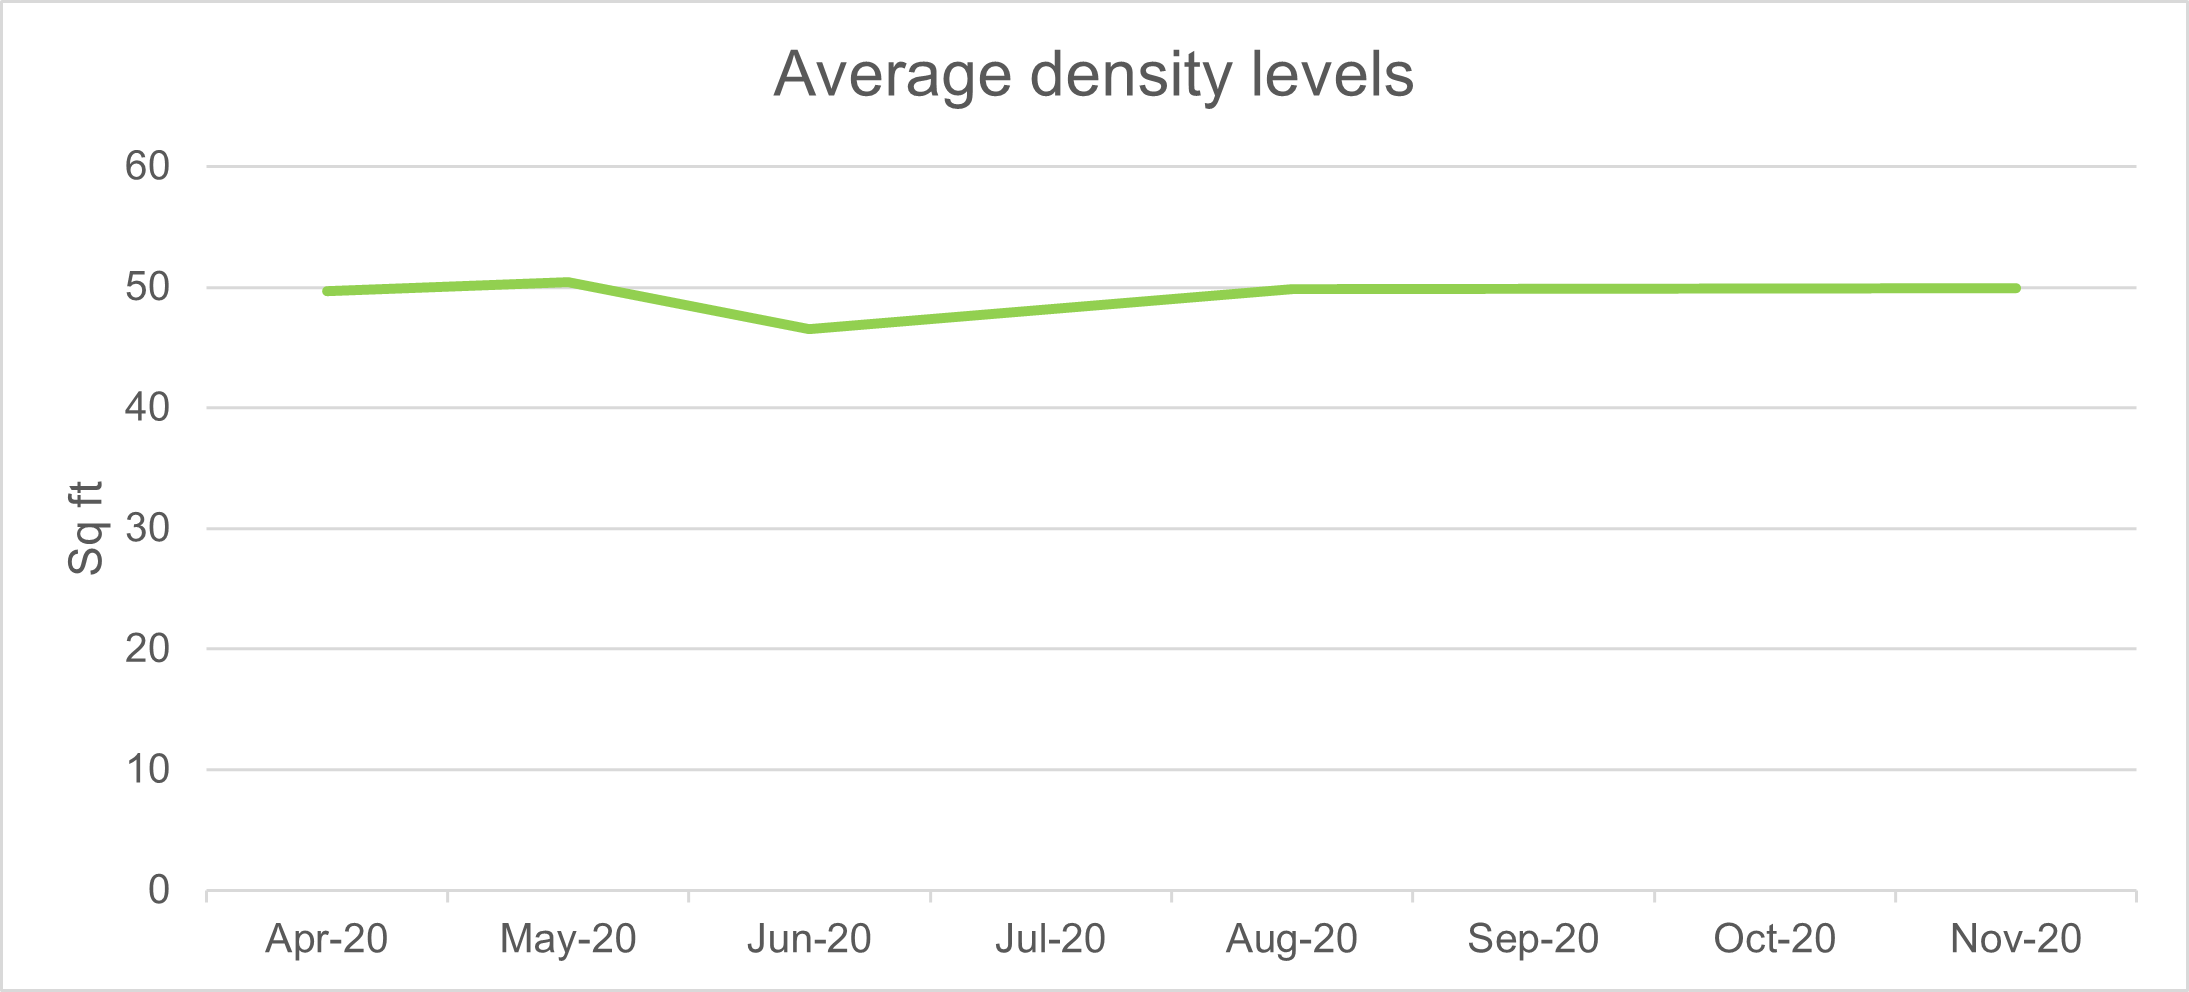
- Workspace Density has remained stable over the past few months despite talk of de-densification
- Manchester has seen a clear trend of occupancy rates falling in city centre locations but rising in the suburbs
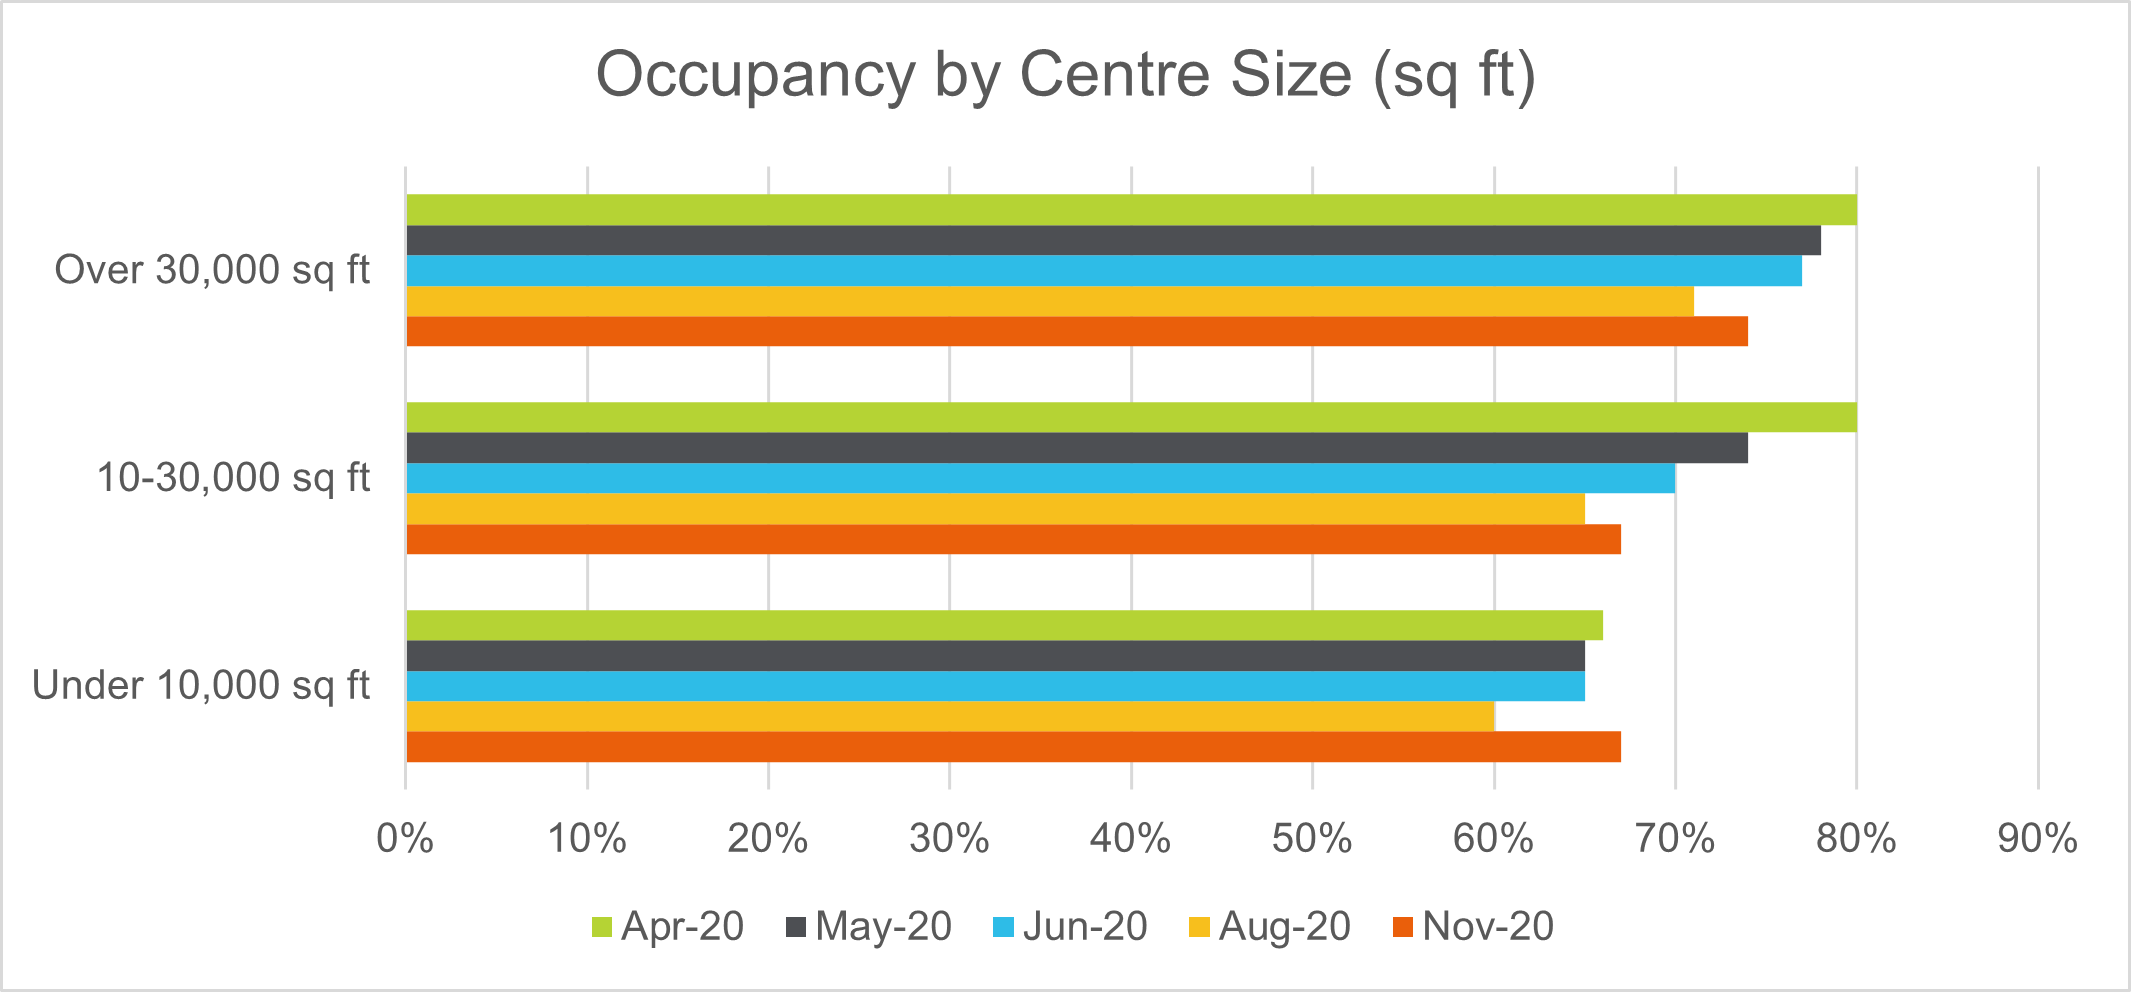
- Larger centres of over 30,000 sq ft have seen higher occupancy rates than medium- to small-sized centres
INTRODUCTION
The impact of Covid has thrown many aspects of the workplace into question, from whether the office is dead, to the changing role of the office and the rise of the dispersed office portfolio. Our unique market data generates an overview of the true impact of Covid on the flexible office market, allowing us to understand how resilient the flexible model is during challenging times and its robustness for the future.
We will examine the real impact of Covid-19 on workspace de-densification and location choice, and question whether suburban markets really can replace or operate alongside urban locations.
IS DE-DENSIFICATION REALLY HAPPENING?
Densification has been a key trend within office space over the past decade. As technology reduced in size, the space each employee needed also decreased, leading companies to maximise the space with additional workstations. That, coupled with the increasing cost of real estate, have been the main driving forces behind densification. However, the pandemic has halted this trend.
With new social distancing measures in place, many businesses will need to rethink their real estate strategies and there will be tension between optimising real estate cost and allowing for social distancing. This has led many conventional landlords to look at dedensification as a means to offer reassurance and implement social distancing but is this really happening in the flex market and what is the impact on the model?
An analysis of the density of 5 of the top operators in the UK reveals that density has remained stable at an average of 49 sq ft per desk over the past few months. Although this does vary from operator to operator, they are all clustered around this average point and are following a similar, stable trend. This is unsurprising as allowing additional square foot per desk would not be financially viable for many providers of office space unless rates increased at a relative level. Instead what we have seen is providers provide the same desk allocation but temporarily close off desks to allow for social distancing. Equally a large amount of seating in open plan spaces has been either removed or reduced, again allowing for social distancing. At the moment most occupiers are seeing reduced numbers of staff in their spaces meaning this approach is acceptable, when numbers increase it will be interesting to see how both occupiers and providers react.
What we are starting to see however, is a shift in client perception from thinking in terms of desk numbers to the amount of space they require, and this will vary depending on their individual social distancing policies and strategies. This in turn may result in more operators providing their availability in terms of square feet rather than the number of desks each office can accommodate. This shift from desk numbers to square feet within the flexible office industry mirrors the overall trend of a move towards thinking of the office as an overall experience, creating tailor made solutions rather than a one-size-fits-all model.
LOCATION, LOCATION, LOCATION
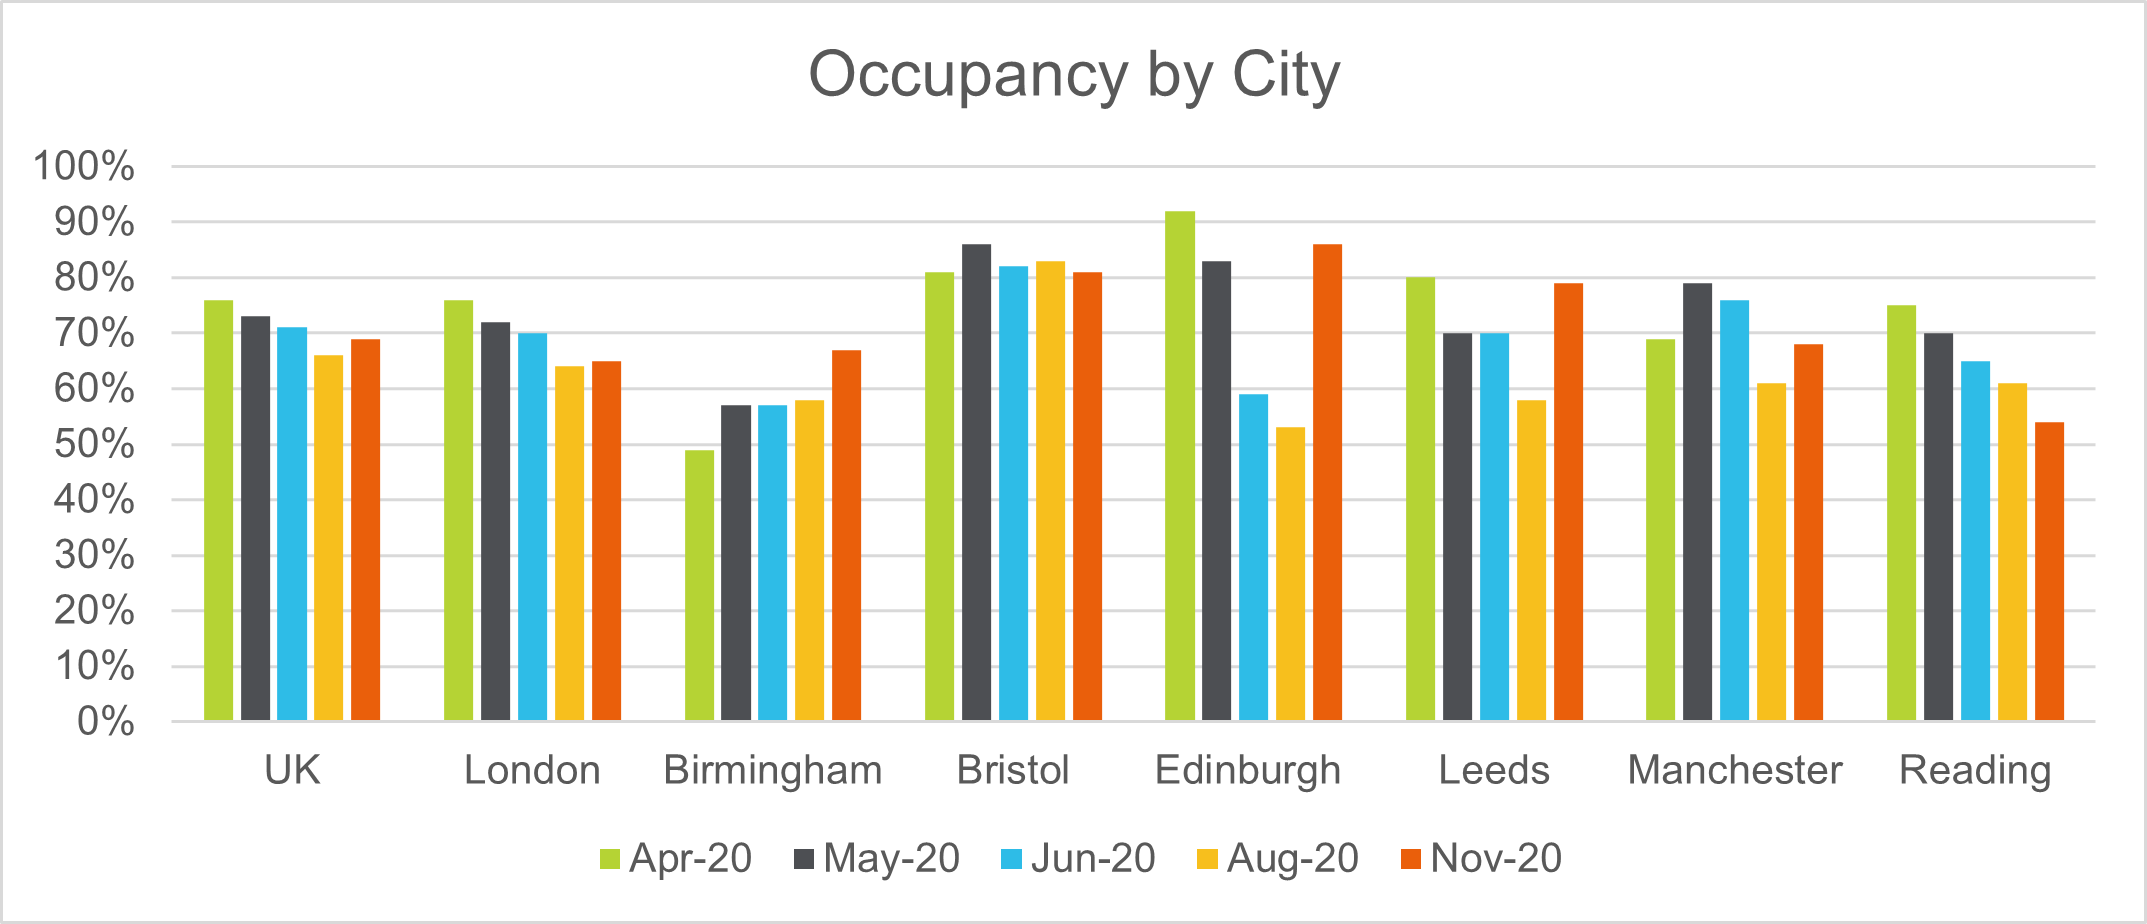
The pandemic forced us into the largest work-from-home experiment in history and as a result everyone has started to question the role of the office and whether we will still need them. It is unsurprising that occupancy levels have largely been on a downward trend throughout much of 2020 as people were forced out of the office due to lockdown and many are reluctant to make that leap back out of the home office, particularly when they have long commutes into work. The UK as a whole saw occupancy rates fall by 9% between April and November 2020. A figure that is far less than might have been anticipated and provides some confidence to those monitoring this highly agile part of the CRE industry. This confidence is further supported by the gradual rise we are now seeing in occupancy levels across many markets as we approach the end of the year.
It is important to note that this figure represents contractual occupancy and real time occupancy or the number of people physically in the buildings is likely far lower, something that is being reported across all areas of CRE at present. Based on our conversations with the industry physical occupancy varies by location but in central business districts can be as low as 15% to 20%, a figure that has been slowly increasing throughout the third quarter of this year.
If we drill down to city level the results are very mixed. Occupancy within a particular city will vary depending on a number of factors, not least how hard the region has been hit by Covid, the types of businesses typically found within that city and the steps being taken by each operator to retain clients.
London has not been as hard hit as other cities. Although occupancy has been declining both within central London and in the outskirts, centres in the central EC, WC and SE1 areas have maintained an occupancy level up to 10% higher than those seen in central Manchester, for example, over the past few months. There will always be companies for whom an urban office hub is desirable with companies like Amazon leading the way in proving their faith in the urban office by revealing plans to expand their office space in 6 hubs across the US. Many other businesses will likely follow suit.
THE RISE OF SUBURBAN MARKETS
Although the urban office is far from disappearing, we do still expect to see a rise in the importance of suburban offices, with both central and satellite offices combining to offer the agile office portfolio options that companies are striving for.
In Manchester, for example, occupancy within centres located on the outskirts of Manchester has risen from 72% in April to 94% in November. On the other hand, occupancy rates within Manchester city centre remain far below this, currently sitting at 57% despite a slight rise throughout the last quarter. This trend supports the rise of the dispersed office portfolio, which allows employees to work from either an urban hub office or a strategically located suburban satellite office. Smaller markets within the Greater Manchester area have also seen occupancy levels rise above those in the city centre during the past quarter, further supporting the trend that employees will be favouring locations closer to home as they return to the office.
There is no one-size-fits-all solution. We have seen occupancy in city centres decline, some more so than others, and some suburban markets are on the incline while other more remote markets are struggling to increase occupancy within their centres. Although occupancy within the centre of Manchester is on the decline, this is inevitable given the imposed lockdown and continuing restrictions. Post the pandemic we expect to see these urban markets start to bounce back, while at the same time being supported by suburban hubs which will start to increase in popularity. In order to meet the varying needs of their workforce, some preferring to work remotely or near to home and others wanting to return to the social environment offered by the main office, businesses will need to create an agile office portfolio with both urban hubs and suburban spokes and the flexible office industry is ideally placed to provide this.
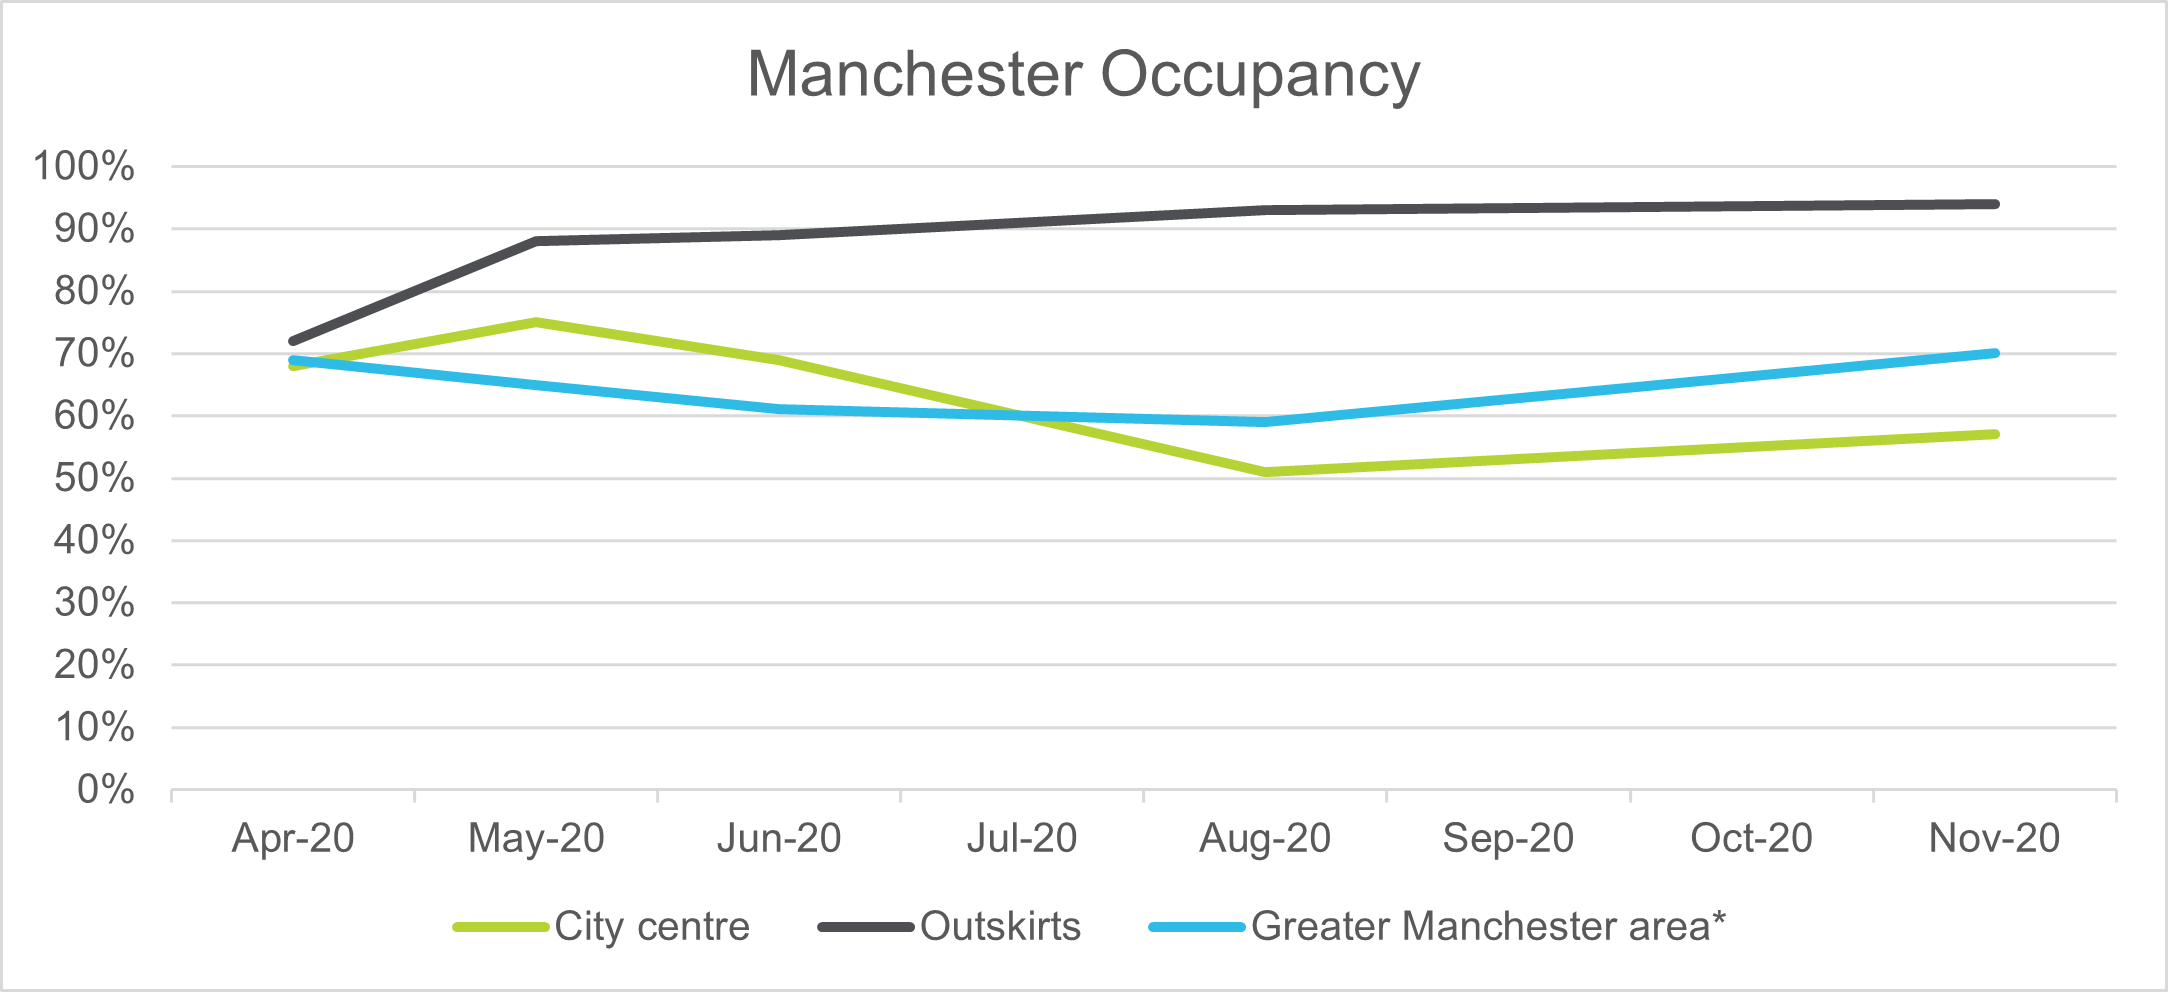
*Includes Altrincham, Bolton, Cheadle, Knutsford and Warrington
DOES SIZE MATTER?
An analysis of occupancy by the size of location shows that, although there is the familiar trend of decreasing occupancy rates across all sizes of centres, there are consistently higher occupancy rates among the larger centres of over 30,000 sq ft.
This suggests that an increasing number of larger companies are moving to flex during this time of uncertainly in order to increase agility within their workspaces. This is a trend that we are seeing across all regions, although the speed at which this is happening differs from region to region, largely dependent on the awareness of flexible workspaces among corporate occupiers and also the supply of high-quality flex space within key cities.
Larger centres were also likely to have a higher proportion of corporate occupiers going into the pandemic with longer lease terms and so we are yet to see the result of Covid-19 on these occupiers and whether they will retain the space or start to disperse chunks of it into satellite locations, something which is easily facilitated by the agility offered by flexible workspace operators.
CONCLUSIONS
Occupancy rates have been declining across the UK, but by no means are as low as could be expected given the circumstances of the past few months and we are now starting to see signs of recovery across many markets. Those outside the industry have always viewed the market as highly unstable, a factor for concern. While it is flexible and agile by its very nature, as we saw during the 2008 GFC, this market tends to buck the trend in times of uncertainty.
Operators of flexible space were some of the first to react quickly to the crisis and put in place measures such as increased cleaning, removed touchscreens, and implemented one-way systems in order to gain client confidence and maintain their occupancy levels.
The pandemic has forced us to question the use of the office and the industry will undoubtedly change as a result. The solution that will emerge will be an agile one, potentially combining urban hubs with strategically placed suburban spokes and together they will provide the ultimate agile workplace solution.
We are potentially seeing the early signs of this activity within our research with occupancy rates in suburban locations appearing to buck the trend and actually increase during the crisis in certain markets.
Note: The sample size for this data is 498 flexible workspaces across the UK.

Read next


Our experts can deliver insights or a flexible workspace report tailored to your specifications.